
IELTS Writing Task 1 Analysis (Marriage and Divorce Rates) – Band 6.5
Let us do complete analysis of IELTS writing task 1 submitted by one of the candidates.
Candidate’s Response:
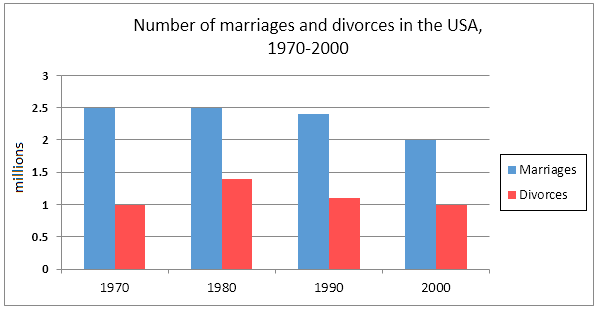
The bar chart illustrate, the information about marriage and divorce rates in USA and American adult marriage status in over three decades, from 1970 to 2000.
To begin with, it can be seen that, the rate of marriages experienced significant drop in the given time period. Even though the rate was constant for two years 1970 and 1980 (2.5 millions), but it witnessed significant decline in further two years 1980 (just over 2 million) and in 2000 exactly 2 million marriages. But divorces rate is showing quite different trend. In 1970, the divorce rate was 1 million and it increased slightly to just under 1.5 million. But the figure again reached to same point that where it started in 2000 (1 million).
While, as far as material status of American adult is concerned, in both 1970 and 2000, adult’s marriage percentage is higher than other three material statuses. But the percentage in 1970 is quite higher than the marriage percentage in 2000. Interestingly, the year 2000 experienced more proportion of divorced adults than 1970, which is neary double. That is just over 3% 1970 to 6% in 2000. While the statuses never married and widowed adults proportions are almost same with slight differences.
In conclusion, Even though marriages rate decreased over the period, they are more higher than the divorce rate in USA. While, in the same way except slight drop in 2000, American adults married in more proportion in both the years.
We will be doing analysis of the above IELTS writing task 1 response as below:
Para 1
Strength:
Main feature of the question is written well along with factual information.
Corrected Erroneous Statement:
“bar chart illustrate, the information” should be “bar chart illustrates the information”, “divorce rates in USA” should be “divorce rates in the USA”, “in over three decades” can be “in over the three decades”
Para 2
Strength:
Sentence connector (to begin with) is used, main key features are explained along with factual information and complex sentences are attempted.
Corrected Erroneous Statement:
“Even though the rate was constant for two years 1970 and 1980 (2.5 millions), but it witnessed significant decline in further two years 1980 (just over 2 million) and in 2000 exactly 2 million marriages.” should be “Even though the rate was constant for two years, 1970 and 1980 (2.5 millions), but it witnessed significant decline in the further two years, 1980 (just over 2 million) and 2000 (2 million marriages).”, “to same point that where it started” should be “to the same point where it started”
Para 3
Strength:
Main key features are again explained well with the given figures, complex structure sentences are attempted and there’s good use of connector “interestingly”
Corrected Erroneous Statement:
“While, as far as” can be “While as far as”, “neary double. That is just” should be “neary double, that is, just”, “While the statuses never married and widowed adults proportions are almost same with slight differences”, “while the statuses of never married and widowed adults proportions are almost the same with slight differences”
Para 4
Strength:
Main conclusive feature is described well.
Corrected Erroneous Statement:
“Even though” should be “even though”, “divorce rate” should be “divorces rate”, “in USA” should be “in the USA”, “While, in the same way except slight drop in 2000, American adults married in more proportion in both the years” should be “while, in the same way except slight drop in 2000, more proportion of American adults were married in both the years”
Expected Band Score: 6.5 Band
The candidate has explained all the main key features with good usage of connectives. However, there are errors in complex structures, grammar, capitalization and others.
Comments:
https://ieltsonlinetests.com/wot/result/writing-practice-test-6-1166483
Could someone please check out my writing and give me feedback? Thank you!
https://ieltsonlinetests.com/wot/result/writing-practice-test-6-1164231
The line graph data provide information about the population of age 65 and aver between in year 1940 to 2040 i three diverse countries.
Overall,japan has heighest proportion of population of age 65 and above in the end of the given years.With little difference of percentage follow by sweden and usa is having proportaion.
Turning to details.In year 1940 all three country having population in between 5 to 8 per cent only.There is a very slightly change in usa and sweden by increasing 1 percent from previous year as well as japan rapidly drop on 3 percent. 1980 having the dramatically change by usa and sweden rope sharply with 5 and 4 percent on other hand japn have constant
In year 2000 japan have slowly increase and stand on 5 percent the other country uas and sweden have moderate change.On the next year japan and sweden having same cange i year 2020 by 5 percent but usa having same position .The end of the giving year 2040 in japan rope sharply by 18 percent other country also having change of 7 percrnt in usa and 7 percent in sweden .
https://ieltsonlinetests.com/wot/result/writing-practice-test-6-1132941
rate my writing pls :(((
hello
https://ieltsonlinetests.com/wot/result/writing-practice-test-6-970034 Please rate my writing
The line graph gives information about the percentage of senior citizens whose age is 65 and above living in USA, Japan and Sweden over a period of century from 1940 to 2040.
Overall, Japan had the least number of old aged people at the beginning of the century whereas USA had the highest and in the end of the century these countries are expected to switch their positions leaving Sweden in the same position.
In 1940, USA was the highest in percentage of people aged 65 and above whereas Japan had only 5%, Sweden on the other hand was only at 7% then these number increased consistently and reached to its peak in 2015 as 20%.
The senior citizens number in Japan was steadied from 1960 till 1990 and then their number increased significantly and are expected to reach 10% in 2030 and these figures further rocketed and would reach its peak as 27% in 2040. Old aged people in USA dropped slightly from 1980 and steadied till 2020, after that their count growed significantly and will be least in number in 2040.
In general, people now a days assume that the best thing to be rich is to help others. However, I completely agree with the statement. Few arguments on agreement and a counter agreement with a conclusion along with an example is provided below.
In my view, people who worked hard and earned respect along with money are the real wealthy persons in our society, these people know the real value of the hard work which comes with knowledge, that gives a person to help and encourage needy.
Rich doesn't mean living in a bungalow or driving a luxurious car, it means God has given an opportunity to support people who are helpless. There are lot of people around us who are suffering from serious illness and students who doesn't have enough money to pursue higher studies. Supporting them treating their illness and giving them a bright future is a blessing and the most satisfying thing.
People now a days are helping poor through social welfare organizations example, one of my friends named Francies, he is working as a CEO for Great Eastern shipping company. Although he owns a good bunglow and drives a luxurious car, he is not a selfish person. He donates half of his annual income to charity for social welfare. Society needs these kinds of people to eliminate poverty and as role models to many who wish to do the same.
On the other hand, think about rich people who are selfish, they may save lot of money without participating or donating to welfare organizations. But the result is they will end up alone, they will be no one to favor them when they are needy.
All in all, it can be said that one should always help and donate to poor who are in need in that way the favor always comes back when they are needy.
The line graph illustrates the percentage of people living in USA,Sweden and Japan who's age is 65 and above over a century from 1940 to 2040.
Overall, percentage of senior citizens living in Japan were initially less compared to other two countries and these figures are expected to raise and reach more than a quarter portion. On the other hand, USA had registered as the highest initially, although these trends continued to raise till 1980, later in the year 2040 this trend is expected to record as least.
In 1940, Japan had the least portion of old aged citizens with a count of only 5% and their count had decreased to half of the portion till approximately 1990's. After that their count is significantly raised and expected to reach almost 28% in 2040.
On the other hand, People in the USA were the highest portion initially in 1940 and they continued to maintain their rank till mid 1990's. Surprisingly Sweden overtook USA place in mid 1990's and reached its peak approximately in 2010.Until 2030 senior citizens in Sweden are expected to maintain top position whereas Japan will be the country with highest portion among the three countries in 2040.
your first line is incorrect , "who's" means who is