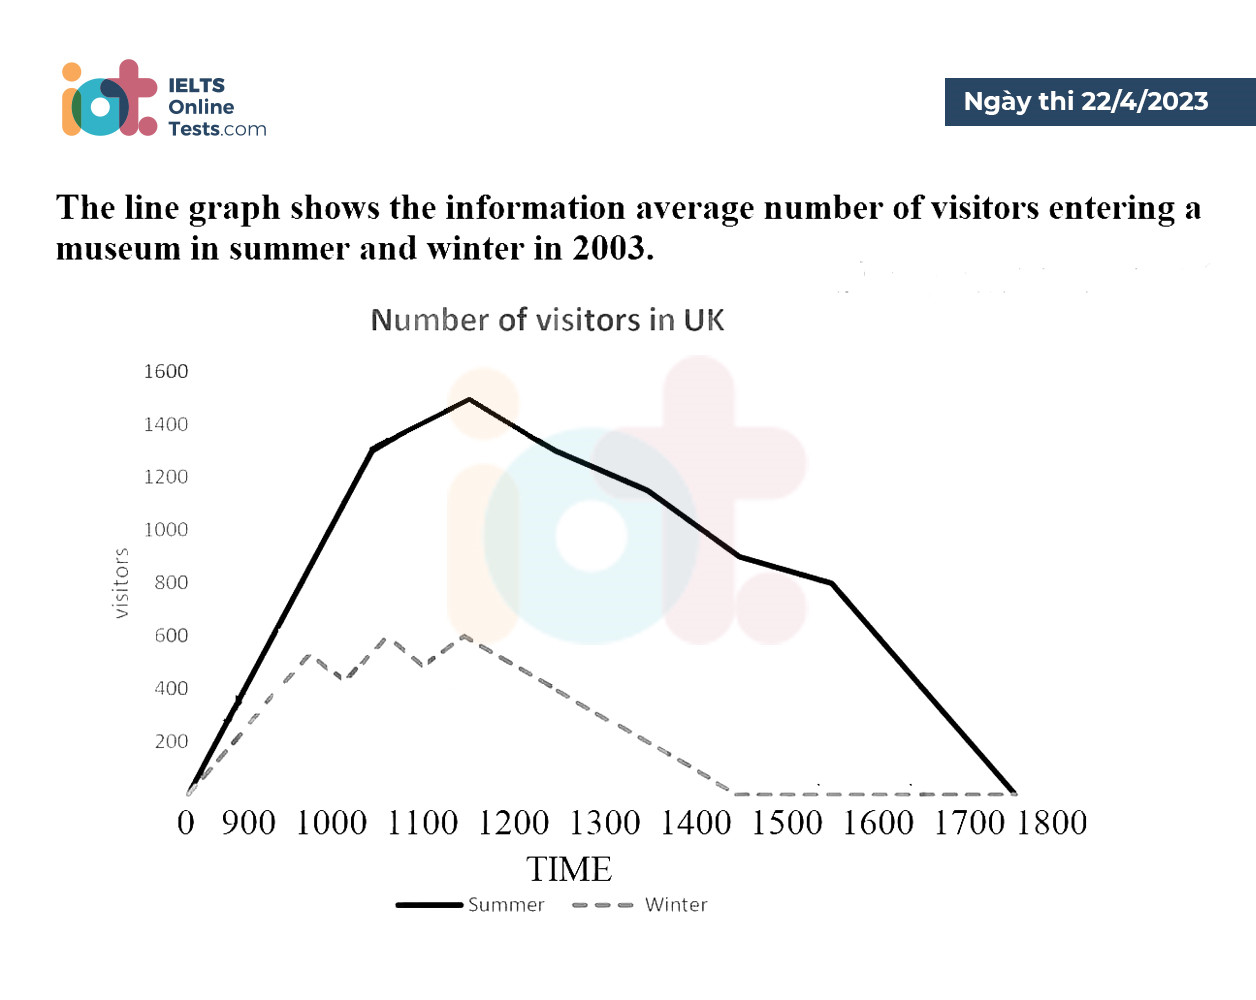
The line graph shows the information average number of visitors entering a museum in summer and winter in 2003.
WRITING TASK 1
You should spend about 20 minutes on this task.
The line graph shows the information average number of visitors entering a museum in summer and winter in 2003.

Summarize the information by selecting and reporting the main features and make comparisons where relevant.
You should write at least 150 words.
(Actual tests in April 22nd, 2023)
Sample answer:
The given graph illustrates the average number of visitors who visited a museum during the summer and winter seasons of 2003. Overall, it is apparent that the number of visitors was higher during the summer season as compared to the winter season.
During the summer season, the number of visitors started at around 200 and rose sharply to reach a peak of approximately 550,000 in August. Following this, the number declined slightly and ended up at just above 400,000 visitors in September. In contrast, during the winter season, the trend was relatively stable with the number of visitors ranging from just below 150,000 to around 250,000 visitors from December to February.
Looking at the comparison between the two seasons, it is worth noting that the number of visitors in the summer season was around 3-4 times higher than in the winter season. This difference is evident throughout the entire year, with the number of visitors reaching its peak only during the summer season.


Comments:
where are you getting the 550 000s, 400,000s, the Augusts and Februarys you are stating?????????????
Either the graph is wrong or its just misleading. please avoid the incorrect answers as it create doubts in mind of students.
very bad
Where are the months?
Either the graph is wrong or its just misleading. please avoid the incorrect answers as it create doubts in mind of students.
what's happenning
Wrong answer where is months
wrong data.........
Ia saya mau bertanya di mana anda mendapatkan 550.00,400.00 dan bulan Agustus dan Febuari,bisa di jelaskan...?
??
Am i tripping or ielts just got harder ?
The data in paragraph is all invalid
from where these numbers and month come? confusing answer