How to Do IELTS Writing Task1 With Only Two or More Charts?
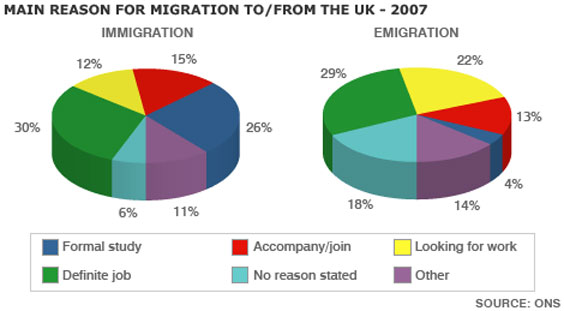
In the IELTS writing task 1, you find question with only one chart which is a very simple task while you also get question where you get only two charts or more than two charts which is a bit complex one. Difficulty level gets increased with two or more than two charts since you get confused about what you should list as key features and what you can leave. At the same time, you are also conscious about time as it takes more time to analyse more than two charts. Let us see how to solve IELTS writing task 1 question only two or more charts:
Step 1: Read the Question and Start Writing your Introduction
Reading the question statement thoroughly is the first thing to do in trying to attempt this IELTS writing task 1. You can paraphrase the question by rewriting the statement and also by using synonyms. Before beginning the introduction, just go through the charts properly to find the heading, x-axis label and y-axis label. You can pick up units given in the x-axis or y-axis while writing introduction. For example, “from the year 2000 to 2010”, “percentage of”, “units of energy consumed” etc.
Step 2: Analyse the Charts Properly
An extremely essential thing if you want to score good band in IELTS writing task 1 is that you should analyse the charts well. Depending upon the number of charts given in the question, you may start analysing the question accordingly. Let’s suppose that you are given two bar charts. First check each bar chart in detail and then try to compare the two bar charts together. Find out the similarities or differences between the two charts. If it is a single chart, you may find bars or lines with different colours. In such a chart, you can look for joining points or peak points. Also, make sure to determine the overall trends if the graphs are declining or increasing.
Step 3: Write Two Body Paragraphs
In two or more than two charts in IELTS writing task 1, it is better to write two body paragraphs so that you can explain the key features of the diagram effectively. It would give better clarity to the examiner when you structure the paragraphs well. In the first body paragraph, list out everything important in the first chart and then do the same for the second chart. However, if you have single chart with two or more colored bars or lines, you can firstly write about the individual bars or lines in the first body paragraph while in the second body paragraph, you can write all the main highlights that you get to know after making comparison of the two body paragraphs.
Step 4: Draw Out Main Conclusion
There can be two or more conclusive features in the IELTS writing task 1. This is also known as main summary of the diagram and you can write it after introduction or at the end. Conclusion has to be written within 2-3 lines and you can write so by including the major feature from both the charts.


