Actual tests in May 11th, 2023 Writing Task 1 (paper-based): Barchart
WRITING TASK 1
You should spend about 20 minutes on this task.
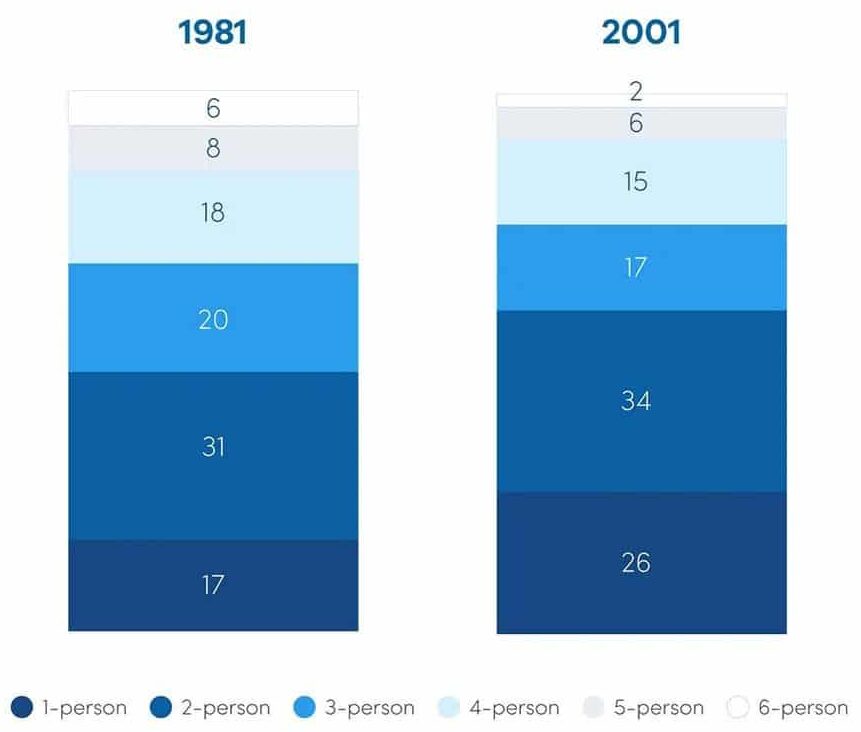
The chart below compare the number of people per household* in the UK in 1981 and 2001.
Summarize the information by selecting and reporting the main features, and make comparisons where relevant.
You should write at least 150 words.
Sample:
The charts illustrate the percentage of different sized households in the UK, in 1981 and 2001.
Overall, the most common sized household in both measured years was that of 2-person households, while 6-person households were the least common. Additionally, while the percentage of 1-person and 2-person households increased, the percentage of all other sized households decreased.
In 1981, 31% of all households contained 2 people, while 20% of households contained 3 people. 1-person and 4-person households made up similar percentages, at 17% and 18% respectively, whereas 5-person and 6-person households only made up 8% and 6% of the total.
By 2001, the proportion of 1-person and 2-person households had risen to 26% and 34% respectively. Meanwhile, the proportion of all other sized households had decreased, with 3 and 4-person households dropping to similar levels, at 17% and 15% respectively, and 5 and 6-person households dropping to 6% and 2% respectively.
(150 words)


