[djonik d] Writing Practice Test 1287934
Task 1
You should spend about 20 minutes on this task.
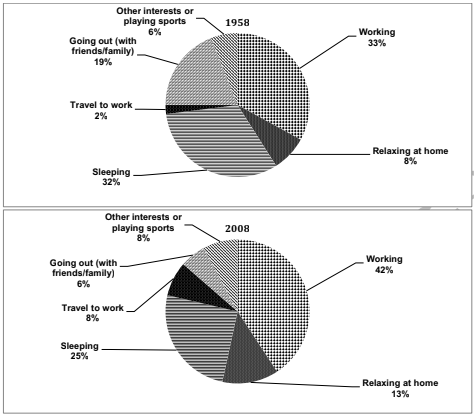
The pie charts below show the percentage of time working adults spent on different activities in a particular country in 1958 and 2008. Summarise the information by selecting and reporting the main features and make comparisons where relevant
You should write at least 150 words.
Two pie charts illustrate the percentage of time working people spent on various activities in each nation between 1958 and 2008.
Overall, it is clearly seen that most people in 1958 most likely spent their activities working and sleeping, while in 2008 similar things occurred, though in different proportions of percentage.
To begin with, in 1958, folks divided their almost half a day into two things: working (33%), and sleeping (32%). Besides, they hang out with friends or family, though not frequently—only 19%. Moreover, relaxing at home, travelling to work, and doing sports were below 10%, which can be said not to be a priority for some people.
Moving into 2008, adults still gave their priority time to working and sleeping. Nevertheless, there is a significant increase in the working percentage, which is up to 42% more than previously, yet the sleeping time decreases to 25% more than the previous one. Furthermore, there is a specific rise in the number of people relaxing at home as well as doing exercise, although hanging out time proportionally is getting lower to 6%.
Task 2
You should spend about 40 minutes on this task.
Nowadays, not enough students choose science subjects in university in many countries. What are the reasons for this problem? What are the effects on society?
You should write at least 250 words.
Community’s feedback
Sorry! We couldn't find any contents.
Score Given by Community
Give a bandscoreLeaderboard:
| # | User | Score | Time | |
|---|---|---|---|---|
| Subid Basaula |  | 7.0 | 59:58 | |
| Yuki Arai |  | 6.5 | 58:09 | |
| Gayane Aramyan |  | 6.0 | 49:19 |

