[djonik d] Writing Practice Test 1280556
Task 1
You should spend about 20 minutes on this task.
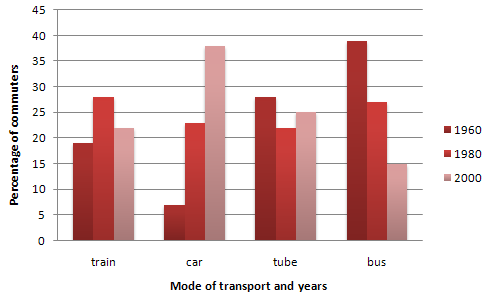
The graph below shows the different modes of transport used to travel to and from work in one European city in 1960, 1980 and 2000.
Write a report for a university lecturer describing the information below.
You should write at least 150 words.

The bar chart gives information about how many transports were used to travel to and from work in one European city between 1960, 1980, and 2000.
Clearly, while the bus sharply decreased for over a 40-year period, the car dramatically increased at the same time.
As we can see from the graph, the general drop in the percentage of commuters was steady. It started at almost 40% in 1960 and plunged to 15% in 2000. A similar trend could be observed in the percentage of commuters on the tube. The figures on the tube fell from 28% in 1960 to 25% in 2000.
car and train increased for the past 40 years. From 7% to 37%, the automobile rose five times. However, trains could increase by 4%, from 18% to 22%. The difference in percentage of commuters by car and train was very noticeable, and the gap had widened over the period.
Task 2
You should spend about 40 minutes on this task.
Write about the following topic.
The percentage of overweight children in western society has increased by almost 20% in the last ten years.
Discuss the causes and effects of this disturbing trend.
Give reasons for your answer and include any relevant examples from your own knowledge or experience.
You should write at least 250 words.

Community’s feedback
Sorry! We couldn't find any contents.


