[Max W] Writing Practice Test 1059227
Task 1
You should spend about 20 minutes on this task.
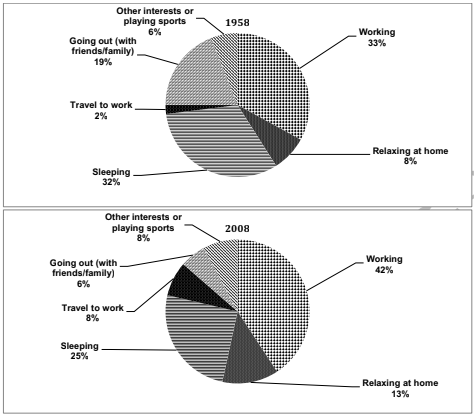
The pie charts below show the percentage of time working adults spent on different activities in a particular country in 1958 and 2008. Summarise the information by selecting and reporting the main features and make comparisons where relevant
You should write at least 150 words.

The pie chart illustrates the amount of time a working adult spends on various activities in a particular country in the years 1958 and 2008.
Overall, The time spent on working has been significantly increased whereas the time spent by a working adult with their friends or family has been reduced over the years.
The amount of time a working adults spends on working has increased over time from 33% in 1958 to 42% in 2008. Similarly the time spent on relaxing at home and the time taken to travel to work has been increased from 8% to 13% for the former and 2% to 8% for the latter.
Activities such as sleeping, going out with friends or family has been a downward trend. The time spent by a working adult for sleeping has been decreased over the time from 32% in 1958 to 25% in 2008. Similarly the amount of time spent with family or friends has been significantly decreased at the end of the period from 19% to 6%.
Task 2
You should spend about 40 minutes on this task.
Nowadays, not enough students choose science subjects in university in many countries. What are the reasons for this problem? What are the effects on society?
You should write at least 250 words.
Community’s feedback
Sorry! We couldn't find any contents.
Leaderboard:
| # | User | Score | Time | |
|---|---|---|---|---|
| Subid Basaula |  | 7.0 | 59:58 | |
| Yuki Arai |  | 6.5 | 58:09 | |
| Gayane Aramyan |  | 6.0 | 49:19 |


