[Jason L] Writing Practice Test 76428
Task 1
You should spend about 20 minutes on this task.
The bar chart below shows the total number of minutes (in billions) of telephone calls in Australia, divided into three categories, from 2001- 2008. Summarise the information by selecting and reporting the main features and make comparisons where relevant.
You should write at least 150 words.
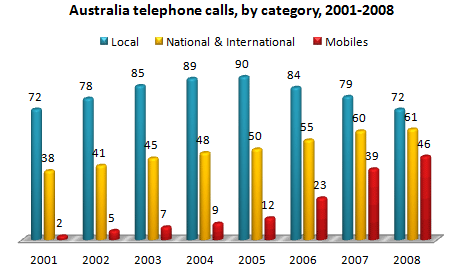
The bar chart below shows the total of minutes (in billions) from three categories of telephone phonecalls in Australia from 2001 to 2008.
First of all, local calls fluctuated from 72 billion in 2001 to 90 billion in 2005, within the same year, local lines decreased to 84 billion and 72 billion in 2008.
Secondly, national and international calls steadily increased from 38 billion in 2001, 50 billion in 2005 and 61 billion in 2008.
Thirdly, mobile calls remained relatively low at the start of the period, with 2 billion in 2001, to 12 billion in 2005. A sharp increase in calls occurred the following year at 23 billion in 2006 and reached 46 billion in 2008.
Overall, local calls fluctuated throughout the period as well as being the most commonly used. Mobile calls started off low, then increased sharply after a few years. national and international calls increased slightly throughout the period.
Task 2
You should spend about 40 minutes on this task.
Some people think the money spent in developing the technology for space exploration is not justified. There are more beneficial ways to spend this money. To what extend do you agree or disagree?
You should write at least 250 words.
Community’s feedback
Sorry! We couldn't find any contents.

