[Nikhil K] Writing Practice Test 469802
Task 1
You should spend about 20 minutes on this task.
The graph below shows the average number of UK commuters travelling each day by car, bus or train between 1970 and 2030.
Write a report for a university, lecturer describing the information shown below.
Summarise the information by selecting and reporting the main features and make comparisons where relevant.
You should write at least 150 words.
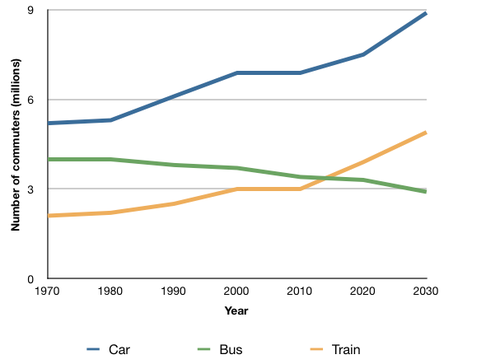
The line graph demonstrates the average number of UK commuters travelling via car, bus, or train. Overall, there has been a huge gain in the number of people travelling through cars, although they have represented the highest portion of commuters from the very beginning since 1970. Those numbers of those travelling via train shall increase as well, but there shall still be four more million people commuting via car. Travel by bus, on the other hand, has and shall experience a steady decline.
There has been an increase in the number of people commuting by car, from around five million in 1970, to around 7 million in from 2000 to 2010. It is further expected to rise to around 9 million in 2030.
The number of commuters travelling via train has increased from about 2 million in 1970, to more than 3 million in 2020. A drastic rise to more than 5 million is predicted by the year 2030. However, the number of people commuting via bus has decreased, from around 4 million in 1970, to just above 3 million in 2020. It is expected to stabilize at 3 million by the year 2030.
Task 2
You should spend about 40 minutes on this task.
Write about the following topic.
With the improvements in today’s health care, society has to care for more and more elderly people.
Do you feel that society will be able to cope with the increase in numbers of elderly people today and how can it be managed?
Give reasons for your answer and include any relevant examples from your own knowledge or experience.
You should write at least 250 words.

Community’s feedback
Sorry! We couldn't find any contents.

