[divya s] Writing Practice Test 1191984
Task 1
You should spend about 20 minutes on this task.
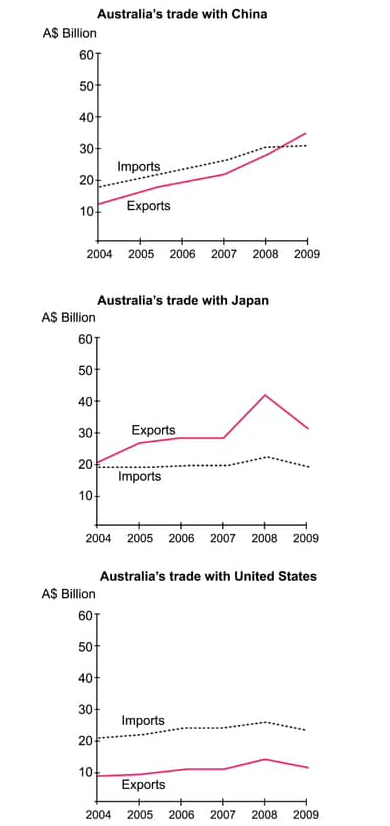
The three charts below show the value in Australian dollars of Australian trade with three different countries from 2004 to 2009.
Write a report for a university lecturer describing the information below.
You should write at least 150 words.

The graph chart represents the data of Australian dollars in trade with the three different countries according to 2004 to 2009 census.
To Subramanyam sastry lecturer in Kakatiya university the main aim of writing this report about the Australias trade. From below mentoined graph A we can see the data which is represented about Australias trade with china the exports of 10 billion dollars which are quiet less than imports of 20 billion dollars from 2004 to 2009 census.
The B graph chart indicates Australias trade with japan more over we can see here that exports of are majorly increased here20 billion dollars to peak rise in 40billion dollars above, rather than the imports of 20 billion dollars from 2004 to 2009.
Regardin the differences of above A&B graph now coming to graph C this information represents data of Australia trade with united states imports were increased of 20 billion dollars and exorts were decreased to billion dollars.
Task 2
You should spend about 40 minutes on this task.
Some people say that in the modern world, getting old is entirely bad. Others, however, say that life for the elderly nowadays is much better than it was in the past. Discuss both views and give your own opinion.
You should write at least 250 words.
Community’s feedback
Sorry! We couldn't find any contents.


