IELTS Mock Test 2024 June
- Published on: 03 Jul 2024
- Tests taken: 613,285
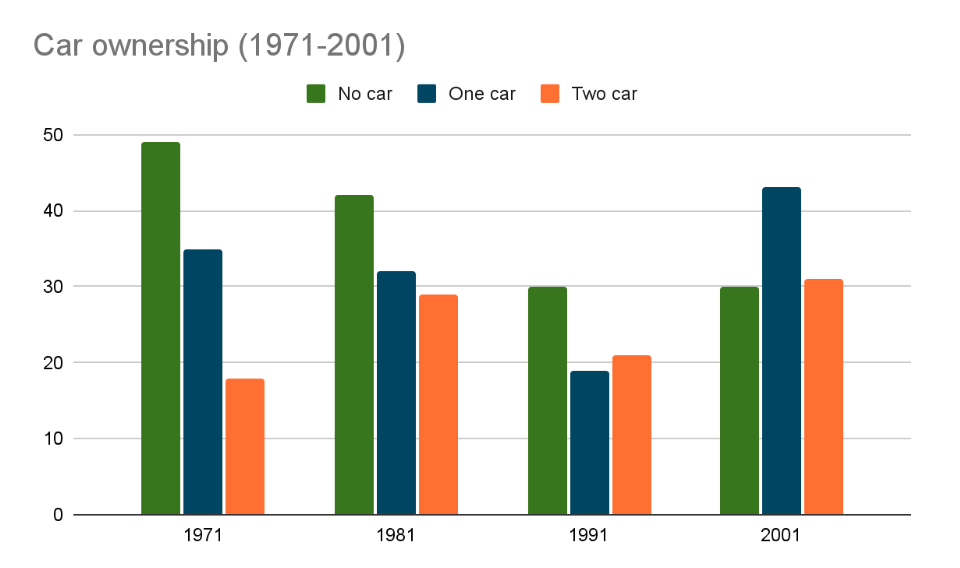
Writing Task 1
The chart below shows the changes in the percentage of households with cars in one European country between 1971 and 2001.Summarise the information by selecting and reporting the main features, and make comparisons where relevant.
You should spend about 20 minutes on this task.
You should write at least 150 words.

Writing Task 2
Many countries have the same shops and products. Some consider it a positive development, whereas others consider it negative. Discuss both these views and give your own opinion.
Give reasons for your answer and include any relevant examples from own knowledge or experience.
You should spend about 40 minutes on this task.
You should write at least 250 words.
Other modules in this test:


