IELTS Mock Test 2023 January
- Published on: 21 Feb 2023
- Tests taken: 5,304,282
Writing Task 1
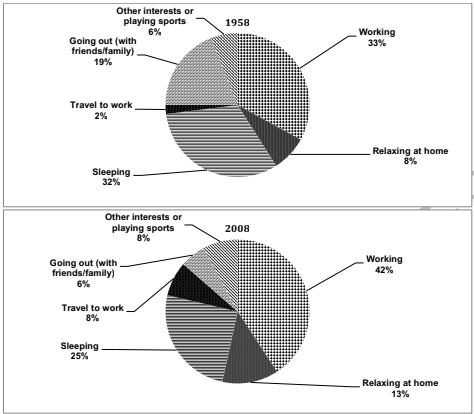
The pie charts below show the percentage of time working adults spent on different activities in a particular country in 1958 and 2008. Summarise the information by selecting and reporting the main features and make comparisons where relevant
You should spend about 20 minutes on this task.
You should write at least 150 words.

Writing Task 2
Nowadays, not enough students choose science subjects in university in many countries. What are the reasons for this problem? What are the effects on society?
You should spend about 40 minutes on this task.
You should write at least 250 words.
Other modules in this test:


