Actual tests in May 13th, 2023 Writing Task 1 (paper-based): Piechart
WRITING TASK 1
You should spend about 20 minutes on this task.
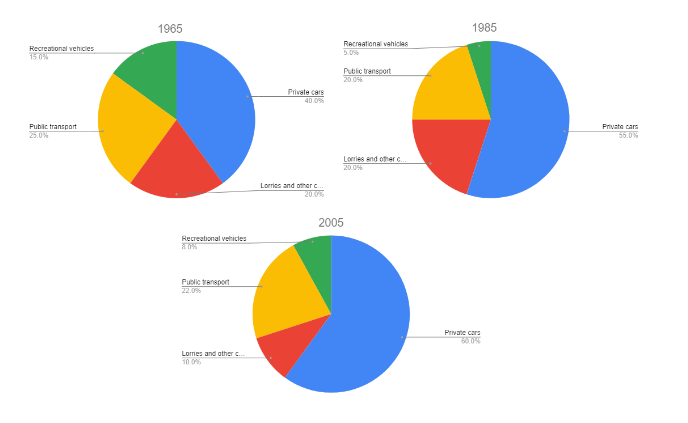
The three pie charts show the proportion of four kinds of vehicles used in the UK in 1996, 1985 and 2005. Summarise the information by selecting and reporting the man features and make comparisons where relevant.
Sample:
The three charts compare the percentage of four different means of transport in the UK in 1965, 1985, and 2005.
Generally, the majority of transportation options, including public transport, lorries and other commercial vehicles, and recreational vehicles experienced a decline over the course of time. In contrast, the popularity of private cars increased noticeably.
From 1965 to 1985, the use of public transport fell slightly from 25% to 20%. Additionally, recreational vehicles saw a significant decrease, halving from 15% to 5%. In contrast, the utilisation of lorries and other commercial vehicles remained stable at 20%; however, the use of private cars witnessed a remarkable growth, increasing from 40% to 55%.
In 2005, the figures for some transport modes recovered from their previous declines in 1985. Recreational vehicles grew marginally, moving from 5% to 8%. Meanwhile, public transport usage grew by just 2%. Moreover, the use of private cars continued to increase despite not as immensely as in the previous two decades. Conversely, lorries and other commercial vehicles dropped drastically, dipping from 20% in 1985 to just 10% in 2005.
(187 words).


