[MSx 1] Writing Practice Test 117073
Task 1
You should spend about 20 minutes on this task.
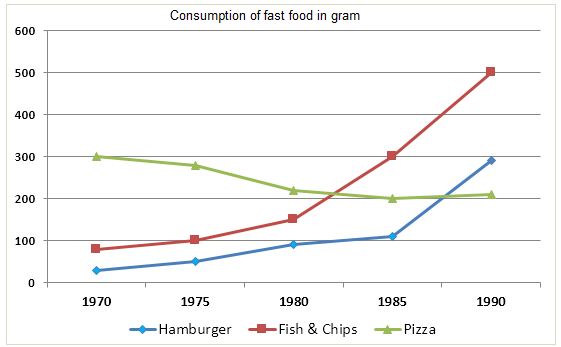
The chart below shows the amount of money per week spent on fast foods in Britain. The graph shows the trends in consumption of fast foods.
Write a report for a university lecturer describing the information shown below.
You should write at least 150 words.
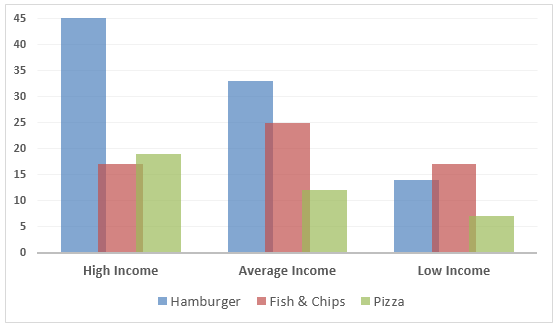
The below graph shows the amount of money spent on fast-foods (hamburger, fish and chips, pizza) in Britain within the three main income groups; high, average and low.
To begin with, hamburger consumption in the higher income group was exactly 45% whereas in the average group it was between 30-35% and almost 15% in the low income group. Moving onto the pizza consumption, the higher income group was at almost 20%, the average was a little over 10% and the low income group consumed only a little over 5%. Similarly, fish and chips was a little above 15% in the high income group and the low income group whereas, the average income group consumed exactly 25% of their income.
To sum up all the data, the higher and average income groups spent most of their income on hamburgers whereas the lower income group spent most of their income in fish and chips.
Task 2
You should spend about 40 minutes on this task.
Traffic and housing problems could be solved by moving large companies, factories and their employees to the countryside. Do you agree or disagree? |
You should write at least 250 words.
Community’s feedback
Sorry! We couldn't find any contents.

