IELTS Practice Tests Plus Volume 2
- Đăng ngày: 15 Dec 2017
- Tests taken: 297,410
Writing task 1
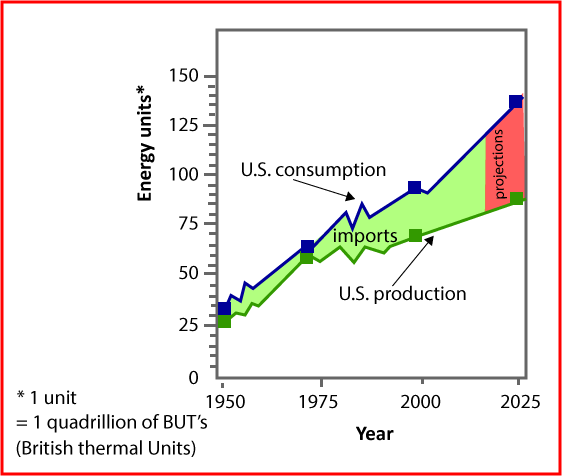
The graph below compares figures for the production and consumption of energy in the US from 1950 to 2000. It also predicts figures for 2025.
Summarise the information by selecting and reporting the main features, and make comparisons where relevant.
You should spend about 20 minutes on this task.
You should write at least 150 words.

Writing task 2
Write about the following topic.
The only way to reduce the amount of traffic in cities today is by reducing the need for people to travel from home for work, education or shopping.
To what extent do you agree or disagree?
Give reasons for your answer and include any relevant examples from your own knowledge or experience.
You should spend about 40 minutes on this task.
You should write at least 250 words.

Free Sample
Đề thi các kỹ năng khác


